Tuesday, December 11, 2012

CHECKING IN ON THE INVESTMENT CASES

A few months have passed now since we have build a number of investment cases for certain shares, or stocks, listed on the JSE. Once again, our attention turns to these particular shares so that we may see how these investments are fairing. 

Firstly, we never ended up buying Invicta Holdings Ltd (IVT). This does not mean that it is no longer an attractive investment however. The general feeling is just that we should not be rushing into any new long term buys, or investments, before we have some certainty about what is happening in the United States - in terms of the fiscal cliff - as well as have some indication that the Chinese economic recovery is sustainable. Once again we reiterate that we are waiting for the opportune moment to present itself. 

Turning our attention to the shares that we did in fact buy, the following comes to light (yesterday's closing prices 10/12/2012):


Please click on the ticker in brackets to see the original investment case.
Share
Bought
Current
% Move
Coronation (CML)
R29.50
R38.45 (+R1.11 divi)
34.1%
MTN (MTN)
R155.00
R170.00
9.7%
Brait SE  (BAT)
R28.00
R36.11
29%
Cashbuild (CSB)
R150.00
R147.50 (+ R2.73 divi)
0.2%
Imperial (IPL)
R185.00
R186.01
0.5%

When looking at these shares, one has to consider that nothing as fundamentally changed with them. They are all still very good companies and the investment cases are still strong for each of them. Some have done better than others it is true, however they true performance will come out over time. Long Term investing is what generates the biggest profits at the end of the day.

We have also been looking at a few new shares that we are considering buying and will be posting some investment cases on them soon.

Thursday, December 6, 2012

DEPOSIT ACCOUNTS vs INVESTMENT PORTFOLIOS


First we need to specify a few assumptions. The first of which being that a 1% annual management fee is charged on both the investment solutions (in other words, we are ignoring the monthly account fees that are charged on a notice deposit account). Secondly, we assume that inflation is a constant 6.1% per annum – although we all know that actual inflation is much higher as we are not exactly big end users of paraffin and staple foods. Third, the rates of return are the average over full 12 month (1 year) periods.

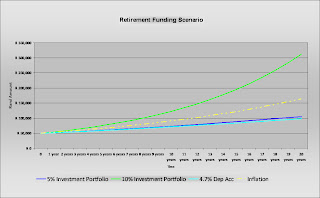
Ok, let’s have a look at how an interest bearing deposit account - from no bank in particular - that earns 4.7% per annum compares against Inflation.

Very clearly, it under-performs inflation rather badly. In other words, as time goes by, the ‘buying power’ of your money is decreasing. So you are becoming progressively poorer over time.

The next step is to compare Investments that grow at 5% and 10%, to both inflation and what is essentially a savings account.

What we notice here is that although the 5% Investment Portfolio – being an investment portfolio that grows at an average of 5% per annum – out-performs the 4.7% deposit account, it still under-performs inflation by some margin. What stands out though, is that if the average annual growth of the investment portfolio is 10%, then the performance far outpaces inflation. This is when real capital gains are made; i.e. when capital grows faster than inflation and the deteriorating effects of inflation are negated. In this particular scenario, the ‘real return’ would be the difference between the investment return – being 10% - and inflation, which works out to 3.9% (Note that the real return for the deposit account is in actual fact -1.4% - meaning that you become 1.4% poorer each year).

When we look at the past performance of the Trading/Investment Model that is used to manage our Investment Clubs, we see that over the last 3 years, they have returned a cumulative 115% over that 3 year period (9.4% in 2010, 46.8% in 2011 and so far 34.37% [annualized] in 2012). Fair enough, we cannot guarantee that we will continue to double our investor’s money every 3 years, but we can say that we aim to attain an annual growth of 15% – 25%, which as we are sure you will notice, is a lot more than the 10% example used above.

We hope that you have found the above both helpful and informative.

Wednesday, November 28, 2012

WHAT THE FUTURE HOLDS


2012 is nearly done and dusted. Time to take a break and start afresh in the new year.


Maybe not! 

There have been some significant developments within the National Treasury this year, as confirmed by Pravin Gordhan’s Medium Term Budget Policy Statement to parliament last month. Furthermore, Gill Marcus has left little to the imagination in the Reserve Bank statements.

2013 will be a tough year.

How does it affect investors? And what trends can we take forward into 2013?

Lesson 1: SA government struggles to collect enough taxes

Gone are the glory days of Finance Minister Trevor Manuel, when tax collections increased by 12% per annum from 2003 to 2008. Most of this was achieved through growth rates of above 4% and inflation rates above 6%. Growing SARS' efficiency and tightening up tax legislation also helped.

Today, Pravin Gordhan faces a very different challenge. Growth rates have declined to 2.5%, and the SA tax base cannot be broadened without a substantial increase in tax rates or the imposition of new taxes (for example, carbon emission taxes).

The National Budget Speech in February 2013 will be a very interesting event. 

Even if SARS achieves its 2012/13 budgeted tax collection target, it would seem the National Treasury will need even more during the 2013/14 tax year. Where will National Treasury find another R100 billion a year to keep SA on track?

Based on certain trends identified in the SARS Statistics 2012 (released in October 2012), increases in corporate tax rates seem unlikely as the principal problems are lower corporate earnings and assessed losses brought forward from the financial crisis of 2008/9.

A VAT increase is the obvious answer, but this would not be received well by organized labour and will probably be avoided.

This leaves personal income tax increases as the only real alternative for National Treasury. The question is rather: ‘what form will it take?’ 

Will National Treasury attempt to increase the super-tax level above 40% on taxable income above R617 000 per annum? This is unlikely as there are simply not enough super-tax taxpayers to make a substantial difference.


Will Capital Gains Tax inclusion rates be increased? This possibility cannot be ignored. But this would be more a measure to contain reduced collections from CGT (now only about R6 billion per annum) rather than generate a new source of income.

Or, will the shortfall be made-up by simply containing the tax-relief granted to all taxpayers? Yes, that is probably the only realistic alternative.

The pressure is on for SARS to find more options. This, coupled with the implementation of the new Tax Administration Act, will mean that penalties and interest charges for the errant taxpayer will be a very unpleasant experience. And there is little that even the most brilliant tax specialist will be able to do to try and get these charges waived or reduced.

For the investor this means that when considering any investment it is critical to ensure that the manager can report tax information timeously and accurately.

Other tax factors are becoming equally critical. ‘The quality of the income’ has become increasingly important.
  • Is it fully taxable revenue income or partially taxable capital income?
  • What type of taxpayer receives the income?
  • Is it a company, an individual, an insurance policy or a trust?

The playing rules in this arena have changed in recent times and should be regularly reviewed when placing investments.

Lesson 2: The SA government cannot borrow its way out of trouble

Pravin Gordhan is almost permanently at war with international rating agencies regarding SA’s credit and investment status and resultant ratings.

Critical in this debate is the extent of SA’s fiscal debt. Simply put, the national deficit cannot be allowed to increase above 4% of Gross Domestic Product. 

The knock-on effect is that the Reserve Bank is under enormous pressure to contain interest rates at current levels as government itself would not be able to absorb the increased interest costs without increasing national debt.

Current after-tax interest yields are below inflation and likely to remain so for the foreseeable future.

The result is that for the investor to generate any real growth, there has to be an exposure to equity-based investments. And with that goes the management of risk profiles of investments. That is a science better left to portfolio managers.

Lesson 3: Lower interest rates and other factors leave the Rand vulnerable

Over the past few years, overseas investors have propped up SA’s balance of payments current account with inward investments seeking to take account of SA’s favourable interest rates.

Recent indications are that international banks will have to deleverage by $4-5 billion during 2013. There is simply not that much money around at present and this has already had a substantial adverse effect on the balance of payments current account and exchange rates against the Rand.

As indicated above, the Reserve Bank cannot increase SA’s interest rates to attract inward investment to prop up the Rand.

Even if one ignores SA’s political risk, the Rand is very vulnerable at present and investors should always be on the lookout for Rand hedge investments. 

Remember, a substantial decline in exchange rates can easily squander a year of carefully generated returns.

Lesson 4: The debate on retirement funds is not over, not by a long way

On paper other investment vehicles simply cannot currently match the tax profile of retirement funds. Where else does the investor enjoy a tax-deductible contribution, followed by tax-free growth and a partially taxable withdrawal?


But this could all change.

Currently, there is a range of proposals released by National Treasury for public comment. At the very least this will lead to capping of tax-deductible contributions with effect from the 2014 year of assessment.

Investors are reminded that for the 2013 year of assessment, contributions to retirement annuity funds are only limited by the 15% of non-retirement funding rule. 

Over the next few years there are sure to be changes affecting preservation requirements and investment allocations within retirement funds. Certainly current concessions granted to living annuities and Regulation 28 of the Pensions Fund Act are bound to receive attention.

There is bound to be much speculation on the final outcome of the National Treasury proposals. The only sure way of containing risk to change is through diversity of investment vehicles.

Lesson 5: The residential property market has not recovered

Back in 2008 American economists Carmen Reinhart and Kenneth Rogoff made news with their publication, ‘The aftermath of a financial crisis’. At the time they predicted that it would take seven years for residential property markets to recover.

At present there has been little recovery in the residential property market and there are few commentators who can sincerely suggest that good times are just around the corner. Some say the recovery of the residential property market will take a decade, others have even suggested a generation.

Meanwhile, the holding costs of residential property have skyrocketed to the extent that some are wondering whether residential property is an asset or liability.

Many SA investors are ‘overweight to residential property’. And perhaps the time has come for many to cut their losses rather than attempt to ride out the market.


Lesson 6: The new energy crisis is here to stay


It seems plain crazy that SA celebrated when the 2012 Eskom increases were contained at below 20%.

Although oil prices dipped below $100 a barrel in the early part of 2012, it did not last long. And the recovery of oil prices, coupled with a weakening exchange rate has taken fuel prices back to R12 a liter.

The Gauteng fuel debacle is not yet over and the resultant loss to National Treasury is running at R5 billion a year. Pravin Gordhan is going to have to recover the position by way of a massive increase in fuel levies with effect from 1 April 2013.

South Africans will be lucky if energy cost increases for 2013 are contained at below 20%.

An integral part of financial planning is to contain expenditure. It would seem that even a Ponzi scheme would struggle to outperform the expected increase in energy prices.

Conclusion

With US President Barack Obama now safely back in the White House, his first challenge is to address the ‘fiscal cliff’. What will the US do to contain its staggering national debt? And with Republican and Democrat America now completely divided on the issue, this has every potential to push the US back into recession during 2013.

The effect of a US recession would have a massive impact on all investors. This is no time to take risks. 

Investment strategy is not so much about how much is made in good times but rather how much is not lost in bad times.


Article written by: Matthew Lester, Professor of Taxation Studies

Tuesday, November 27, 2012

THE TROUBLES AND WOES OF ARCELORMITTAL (ACL)

In all honesty, digging up all the dirt there is to find on ArcelorMittal (ACL) would take a very long time.  Instead, we will merely have a brief look at some of the more recent events that have occurred. 

The first thing that jumps to the fore, is that the French government has made a few very damning comments about the company and the French Minister of Industry, Arnaud Montebourg,  actually went as far as to say "We no longer want Mittal in France because they haven't respected France". Now this may seem fairly straight forward, but ACL is owned by a Mr. Mittal, so this row might be a little more personal the what it may appear.

Regardless of what the French think, the English - in the form of London's Mayor Borris Johnson-  have come out and said "if France doesn't want you, Britain does". This certainly does appear to be a good story unfolding right in front of us. It's not every day that countries start arguing with, and over, the worlds bigger steel producer. We will certainly stay tuned for more. In the mean time, let's have a look the 'technical' picture by turning our attention to some charts. 

First up is the Daily Chart. You will notice that the overall trend is very obviously down. So down in fact that over the last 12 months ACL has fallen 45.4% during the period. 

ACL - Daily Chart

Another thing that should stand out is that there is the makings of the Tweezer Top and Dark Cloud Cover candle formations. Now I say 'the makings of' as the day is not yet over and the formations are therefore not yet confirmed.

Second up; we will look at a shorter time frame, in particular, a 1 hour Chart.

ACL - 1 Hour Chart

What should stand out here is that there are two types of divergence present; both reverse divergence and both are bearish. 

Now when you consider that ACL warned Trade Unions that next year will "mark the low point in the cycle." and the feeling is that there is room yet for AcerlorMittal's woes to do nothing but increase over the 6 to 12 months to come.

Sources:

Tuesday, November 20, 2012

ARE YOU AS READY TO RETIRE AS YOU THINK?

The answer to the question above, like the answer to so many of life's most important questions, comes in the form of an equation. Luckily; unlike many of the other important equations, this one is rather simple. However, you must take care not to allow its simplicity to fool you into believing that it is less important than the more complicated equations fighting for their moment in the spotlight. This particular equation is possibly one of the most important equations ever! Well, maybe not ever, but you get the idea. It's pretty important.

So what is the equation? Well, this:
(monthly expense) x 20 x 12 = (required amount to fund monthly expense indefinitely)

That seemed simple enough. 

There are however a few underlying assumptions that need to be pointed out here. The result of the equation being "required amount to fund monthly expense indefinitely", is not a big pile of cash. Not at all. This is the amount that you will need to grow at the rate of inflation AND yield 5% income from, every year, in order to fund the "monthly expense" indefinitely. The capital amount needs to be invested in something that will keep up with, or outpace inflation (hint: it's Equities) as well as yield an income of 5% per year (hint: it's Equities) or the capital will simply run out. And sooner than you think, especially with inflation working against you. Therefore for the sake of simplicity, it can be re-written as "required portfolio size".

Ok, so now we have the groundwork done. Let's put something in the equation and see what it does. Let's say that you are an individual that likes the outdoors and sleeping under the open sky (come rain or shine). Luckily, you already have warm shoes, a few blankets and a nice Shoprite trolley; so all you really need is bread and milk to stay alive. So that comes to what? R 25 a day, or R 775 per month. Ok, here we go:

R 775 x 20 x 12 = R 186 000

And there you have it. R 186 000 will allow you to spend R 775 per month for the rest of your days. Provided that it is growing at least at the rate of inflation and generating income equal to at least 5% of the total capital (being R 186 000). Each year your capital base will grow and your 5% earnings will be proportionally bigger, so you will not get poorer as time goes by due to inflation. You will be able to buy a bread and some milk every day despite the  affects of inflation eroding the buying power of your money. That sounds pretty secure. Although, somehow I don't think there are too many 'out-doorsy' types reading this blog. So lets use a "monthly expense" base that is a little bigger, so that we may allow for a small apartment and say, R30 per day for food. 

So lets see, a small apartment is what, R 3 000 per month? Ok, we'll say that includes water and electricity. Then R 30 a day for food is, well, a modest budget of R 930 per month for groceries. I think we'll also add a R 250 cellphone contract in here for good measure; you know, so you can stay in touch with your loved ones and all that. So that totals R 4 180 per month. Here goes:

R 4 180 x 20 x 12 = R 1 003 200

A million Rand. Wow. That can't be right can it? Let's see... R 1 003 200 x 0.05 (5% yield) / 12 (months) = R 4 180. Yep, it's right. R 1 003 200 yielding 5% a year will provide enough income to sustain expenses of R 4 180 per month. Again, it is vitally important that this capital base is invested in something that will provide this sort of income/yield (5%) as well as grow at the rate of inflation or you will become poorer with every passing year as inflation erodes the value of your money over time (hint: it's Equities). 

By now I am sure that you are getting the picture. To some reading this; retirement is still a far off problem for the future, and to others it is a sudden and chilling realisation that they are not prepared at all. Regardless of which one of these two you are, you need to start saving, no, investing for your retirement right now. There is no other way.

If we bump the "monthly expenses" up to something realistic, the numbers start getting scary. Let's say your monthly expenses come to R 9 000 per month (which by all standards, is not really very much) and you wish to maintain your current lifestyle during retirement. What are you working with now? Let's see; same house as above, maybe R 1 400 worth of food now, car insurance (old cheapy but hey, it's paid off) for R 1 000, medical aid (old people need these) of R 2 500, cellphone of R 500 and R 600 worth of petrol (which is only 1 tank if you think about it). 

R 9000 x 20 x 12 =  R 2 160 000

If you want to retire on R 25 000 per month, you can imagine that the number gets a lot bigger. Fear not, for there is a solution. Can you guess what it is? By now I sincerely hope you can, but where do we begin...?

INVESTMENT CLUB UPDATE - SGIC

Our investment club has been in the market now for just about a month and has thus far done fairly well. The portfolio consisted of 10 long positions and 10 short positions. That mix has now been slightly changed to 11 long positions and 10 short positions, however, exposure on both sides remains equal. 

Since the last update, SGIC spent some time hovering around the break-even mark before reaching a high of slightly over 13% up. Ok, I make is sound dramatic... it took a few days to get going and at one stage traded well above 13% in profit, but that lasted only a few hours and it ended that particular day 11.62% up overall.

The market then had a period of trading lower and lower and naturally, SGIC took a bit of a hit, although it remained in positive territory the whole time. The portfolio within SGIC is exaggerating the moves of the Top 40 (due to the gearing), however it is not participating in the downside as much as what it does when the market rallies. In simple terms; without  any gearing when the market falls, SGIC wouldn't fall as hard; and when the market rallies, SGIC would rally harder than the market. Also, the volatility of the portfolio would be less than that of the Top 40 index. 

We have added some gearing to the mix though and what we have now, is a portfolio that looks set to outperform the market very well over the longer term. Here is a performance chart comparing SGIC to the Top 40 Index as at the close of the market yesterday. 

SGIC vs Top 40


Friday, November 16, 2012

WHAT IS THE FISCAL CLIFF?

The Fiscal Cliff Explained
“Fiscal cliff” is the popular shorthand term used to describe the conundrum that the U.S. government will face at the end of 2012, when the terms of the Budget Control Act of 2011 are scheduled to go into effect.
Among the laws set to change at midnight on December 31, 2012, are the end of last year’s temporary payroll tax cuts (resulting in a 2% tax increase for workers), the end of certain tax breaks for businesses, shifts in the alternative minimum tax that would take a larger bite, the end of the tax cuts from 2001-2003, and the beginning of taxes related to President Obama’s health care law. At the same time, the spending cuts agreed upon as part of the debt ceiling deal of 2011 will begin to go into effect. According to Barron's, over 1,000 government programs - including the defense budget and Medicare are in line for "deep, automatic cuts."
In dealing with the fiscal cliff, U.S. lawmakers have a choice among three options, none of which are particularly attractive:
  • They can let the current policy scheduled for the beginning of 2013 – which features a number of tax increases and spending cuts that are expected to weigh heavily on growth and possibly drive the economy back into a recession – go into effect. The plus side: the deficit, as a percentage of GDP, would be cut in half.
  • They can cancel some or all of the scheduled tax increases and spending cuts, which would add to the deficit and increase the odds that the United States could face a crisis similar to that which is occurring in Europe. The flip side of this, of course, is that the United States' debt will continue to grow.
  • They could take a middle course, opting for an approach that would address the budget issues to a limited extent, but that would have a more modest impact on growth.
Can a Compromise be Reached?
The oncoming fiscal cliff is a concern for investors since the highly partisan nature of the current political environment could make a compromise difficult to reach. This problem isn’t new, after all: lawmakers have had three years to address this issue, but Congress – mired in political gridlock – has largely put off the search for a solution rather than seeking to solve the problem directly. Republicans want to cut spending and avoid raising taxes, while Democrats are looking for a combination of spending cuts and tax increases. Although both parties want to avoid the fiscal cliff, compromise is seen as being difficult to achieve – particularly in an election year. There's a strong possibility that Congress won't act until the eleventh hour. Another potential obstacle is that the next Congress won't be sworn in until January 3, after the deadline.
The most likely outcome is another set of stop-gap measures that would delay a more permanent policy change until 2013 or later. Still, the non-partisan Congressional Budget Office (CBO) estimates that if Congress takes the middle ground – extending the Bush-era tax cuts but cancelling the automatic spending cuts – the result, in the short term, would be modest growth but no major economic hit.
Possible Effects of the Fiscal Cliff
If the current laws slated for 2013 go into effect, the impact on the economy could be dramatic. While the combination of higher taxes and spending cuts would reduce the deficit by an estimated $560 billion, the CBO estimates that the policies set to go into effect would cut gross domestic product (GDP) by four percentage points in 2013, sending the economy into a recession (i.e., negative growth). At the same time, it predicts unemployment would rise by almost a full percentage point, with a loss of about two million jobs. A Wall St. Journal article from May 16, 2012 estimates the following impact in dollar terms: “In all, according to an analysis by J.P. Morgan economist Michael Feroli, $280 billion would be pulled out of the economy by the sunsetting of the Bush tax cuts; $125 million from the expiration of the Obama payroll-tax holiday; $40 million from the expiration of emergency unemployment benefits; and $98 billion from Budget Control Act spending cuts. In all, the tax increases and spending cuts make up about 3.5% of GDP, with the Bush tax cuts making up about half of that, according to the J.P. Morgan report.” Amid an already-fragile recovery and elevated unemployment, the economy is not in a position to avoid this type of shock.
The cost of indecision is likely to have an effect on the economy before 2013 even begins. The CBO anticipates that a lack of resolution will cause households and businesses to begin changing their spending in anticipation of the changes, possible reducing GDP before 2012 is even over.
Having said this, it's important to keep in mind that while the term “cliff” indicates an immediate disaster at the beginning of 2013, the impact of the changes - while destructive over a full year - will be gradual at first. What's more, Congress can act to change laws retroactively after the deadline. As a result, the fiscal cliff won't necessarily be an impediment to growth even if Congress doesn't address the issue until after 2013 has already begun.

Wednesday, November 14, 2012

INVESTMENT CASE - ANGLO AMERICAN PLC (AGL)

At risk of analysing a share that is analysed by so many other people, we would like to talk very briefly about Anglo American PLC (AGL). Simply put, we are of the belief that AGL is presently offering a lot of value at current levels. It is no secret that we were not very bullish on resource companies in recent times. The industrial action and, shall we call it, 'political unrest' in the sector has been keeping us away thus far. 

AGL has been slowly climbing its way up the ranks of our buy list as the fundamentals of the company are improving. Our proprietary valuation model now ranks it as the 20th strongest share on the Johannesburg Securities Exchange with an intrinsic value of R356.45 a share. This then means that it is trading at a deep discount of almost 31% at present levels (R256.00).  Recently it tested the R270.00 level and reversed back down to present level. We believe that this is our opportunity to buy some stock, although it must be said that there is still a chance that it trades down to R235.00 our expected rally plays out. Therefore, we have dipped our toes in the water by getting some stock yesterday at R243.50 and will be ready to add when AGL either hits the next major support level, or if our expected rally plays, we will be buying in the dips.

AGL - Daily Chart
At present the dividend yield comes in at 2.46%, which is slightly shy of its historic yields - before it suspended dividends during the financial crises. Although, with a PE Ratio of 10.14, it certainly is relatively the cheapest it has been in many decades.

Thursday, November 8, 2012

STANDING BACK TO SEE THE BIGGER PICTURE

Every so often it is good to stop and look around, to stand back and stop squinting our eyes so that we may see the bigger picture. We find ourselves becoming so focused on what is happening in the market at this very instant and how it is going to affect the next 2.5 milliseconds worth of price action - or what the next big winning trade is going to be - that we all too often take our eyes off what it is that actually drives the market. Well, that too is debatable if you think about it, although what we are referring to is the trend. The long term, bigger picture.

Now at this stage we are supposed to express an opinion about whether we are in a Bull Market or not. We say this; have a look at a weekly ALSI chart and you decide for yourself. To make it a little easier for you, there is just such a chart below.

ALSI - Weekly Chart

As you can see from the chart above, there is a strong uptrend in place. Worthy of noting is that the channel in which the ALSI (JSE Top 40 Index Futures) is trading now has been intact since the end of the recession in 2009. This is clearly a long term trend then, and long term trends tend to stick around for long periods of time, hence the phrase 'long term trend'. So what does that not-so-witty babble mean? you might ask. We'll get to that in a moment, lets continue to look at the weekly chart above. You will also notice that the 89 Moving Average has tucked in below the price line (candles in this case). This indicates that the trend has  changed from bearish to bullish. Again, this is old news, it happened in 2009 so why is it important now? Alright, let's now look at some more recent events. Notice the rather steep upward movement over the last, let's call it, 4 months? Notice how this is accompanied by reducing trade volumes as well as bearish divergence on the stochastic oscillator? These are the precursors to a correction phase. 

So now, we've made a bullish and bearish case on the chart above. Although what should be pointed out is that the 'bearish case', as one would call it, is a lot more 'short term' than the 'bullish case'. What the chart shows is that the immediate rally over the last few months might be reaching its top. Does this mean that we should all furiously start short selling ALSI contracts until our ears start bleeding purely from over-exposure to clever derivative products thrown around by unrelenting market forces? No. What it means is simply that, by looking at the past behavior of the South African market, we could be entering into a consolidation phase - that might last a few months - before the overall trend continues to push higher. 

So, that being said it is important to understand that the past does not always repeat itself and when looking at these charts and news coming from around the world, we can simply try to interpret the signals as best we can. Is the market going to trade up and test the top of the channel before it corrects? Certainly we would all love to see that! But what if it comes off a little first, to make sure that the support indicated by that bottom trend line is still there? The outcome of the next few weeks, days, hours, minutes, seconds... the closer we look, the more difficult and unpredictable -even random - it becomes so why try to predict it? Why not simply say that we will know when it gets there?

Our job is really simple. We who trade the markets; we really have only 2 very simple things to do. First; follow the market. Don't predict it, don't anticipate what it's going to do, don't even dare start hoping that it is going to do something that you want it too. Just follow it. Second; and probably the more important - and difficult -one of the two, is to take advantage of the opportunities the market give us. To act in our own best interest. To search out opportunities that will allow us to grow our capital safely and when we find these opportunities, to take them. It really is that simple. 

So when Draghi talks of the European Union's slow growth and various stimulus options based on certain conditions, or that they hope to keep inflation below 2% while keeping interest rates at 0.75%. When we read and hear about the severe situation in Greece and how desperate those poor people are becoming. When we hear about 'the fiscal cliff' on an almost daily basis. It all sounds as if the market is ready to fall at any given moment. It sounds like the world is on the brink of disaster and yet, it's not. This is the cyclical nature of life. So instead of trying to pick the top, or trying to predict what is going to happen next, rather sit back and say; wait a minute, this market is trending up... so if it falls, I should be ready to buy the very best shares available on the market so that I can really grow my capital base as efficiently as possible. 

The trick is now to make sure that you are buying the very best shares available on the market. Some of them have been mentioned on this blog before and surely some more will come up in future (although let's face it, our clients will know long before we let the public know). Looking at the shares that we have discussed on this blog, the results speak for themselves. The real magic in the stock market is not knowing what is going to happen, or being the best aggressive trader, no. The real magic is in how you valuate companies and basing your buying or selling decisions on that valuation. We might have said this before, but we'll say it again. Ignore the noise and buy a good stock at a good price.

To summarise the above, we have established that in the shorter term, the probability of a market correction is getting higher and higher although exactly when it is going to happen, we cannot nor will attempt to say. It could be as early as tomorrow, it could only start in February next year. In the longer term though, the trend is still bullish and until that longer term trend is broken, we will continue to be bullish. We also spoke about finding value in the market, or finding undervalued shares and ignoring the shorter term noise that does so well at distracting us from what it is we are really trying to achieve; the creation of wealth.

Monday, November 5, 2012

SGIC UPDATE: 15th TO 31st OCTOBER 2012


As we mentioned before, SGIC has traded into a market neutral portfolio. The cost (in terms of brokerage) to assemble, or construct, this portfolio was approximately 3.25% of the total capital base of the investment club, putting the club (after Monday) at -3.25%. This was followed by two days of drawdown which put the club as far down as -7.28% (thus far being the maximum drawdown). SGIC recovered quickly however, and soon was floating around the break even mark, sometimes even edging into profitable territory. 

Sadly, when the market closed on the 31st of October, the club's performance was at -0.92%. Although it must be said that we are very pleased to have made up the brokerage costs that we had to pay so very quickly. It is still very early days for the club and there are still many months of trading ahead of us before we can really know how we are performing in comparison with the overall market. 

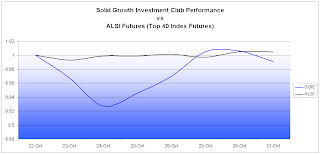
We have however created a performance chart that we will be using to track the performance of the club relative to the Top 40 index. For the moment, SGIC is being compared against the daily close of ALSI Futures contracts; which will be changed to the spot Top 40 index when next we give you an update. 

Relative Performance of SGIC vs ALSI

Wednesday, October 31, 2012

TAKING STOCK - TRADE RECOMMENDATIONS AND UPDATE ON INVICTA (IVT)


Since the end of the month is upon us once again, the time has come to have a look at the Investment Cases that we have put forward and see how these cases are fairing.

First we will start with the most recent of the lot, being Invicta Holdings Ltd (IVT). We are still comfortable with a longer term investment in IVT, however we are waiting for confirmation that the symmetrical triangle formation is going to push the price higher before we commit to buying any stock. It must be said though that it does look attractive at its current price, but patience is of utmost importance. Right now we are waiting for confirmation that the immediate down trend will end and not break out the bottom of that triangle. If such a break lower does occur, then it will put us in a more favourable position as  it would mean that we can get IVT for much cheaper. For now though, we have to watch rather carefully for the opportune moment to present itself. 

We also had a few words to say about Imperial Holdings Ltd (IPL) during the last month. We bought some stock at R182.05 and some more at R185.00. For the purposes of this blog, we will record the entry as R185.00 as that is where the majority of the volume was bought. Since most times we buy rather sizable volumes of shares on behalf of our clients, the average price we pay for them is rather important. 

Take note that all the prices used in the table below are the closing prices from yesterday (30 October 2012):

Share
Bought
Current
% Move
Coronation (CML)
R29.50
R33.00
11.86%
MTN (MTN)
R155.00
R156.00
0.64%
Brait SE  (BAT)
R28.00
R34.85
24.46%
Cashbuild (CSB)
R150.00
R149.00 (+ R2.73 divi)
1.15%
Imperial (IPL)
R185.00
R196.85
6.40%

 
We will be keeping our eye on IVT and will post an update as soon as we have decided to buy.

Also take note that we will be posting the performance of the Solid Growth Investment Club in the coming days, so remember to come have a look at that. Further, we really like the feedback we are receiving on the poll that can be found at the right (upper) are of our blog.  We would like to thank you for the votes and want to encourage you to please keep those votes coming so that we may know how best aid you in your trading and investing journey.