
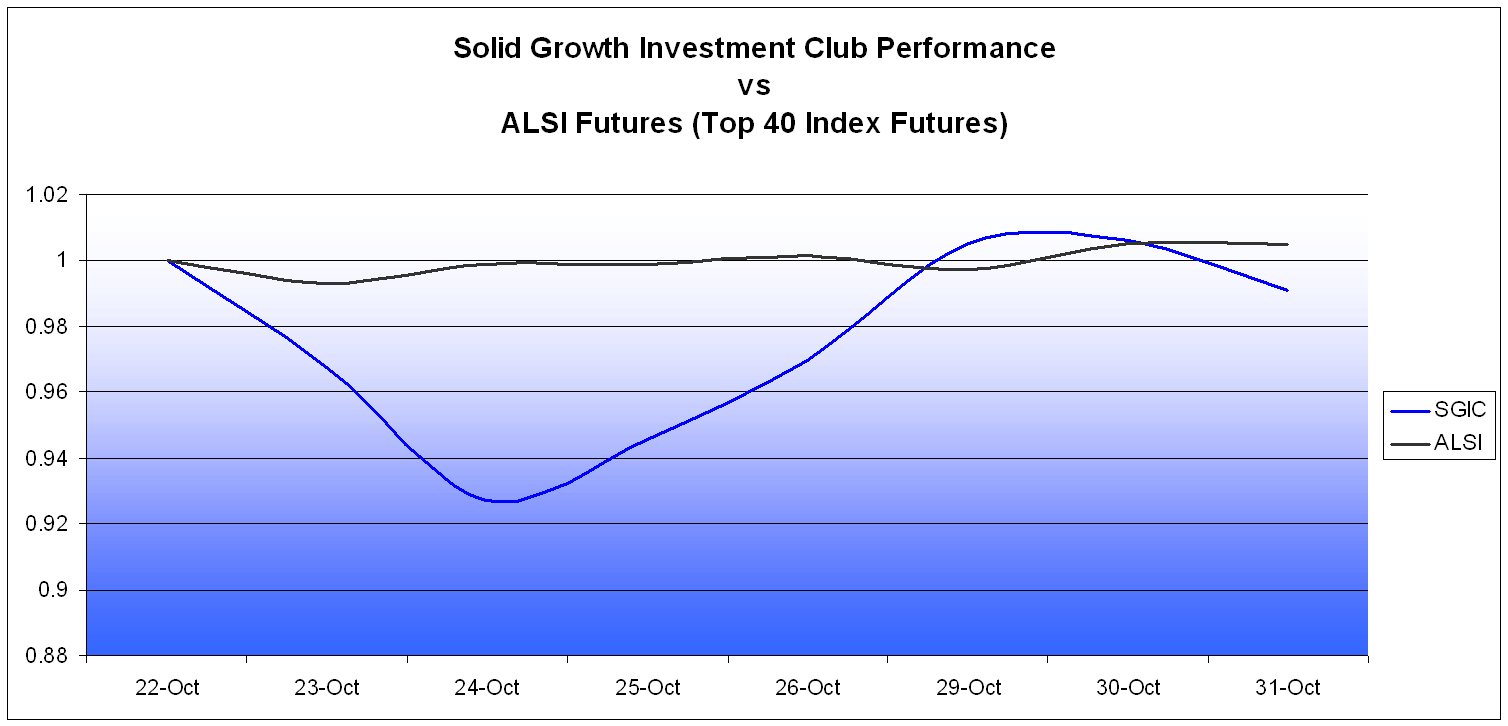
As we
mentioned before, SGIC has traded into a market neutral portfolio. The cost (in
terms of brokerage) to assemble, or construct, this portfolio was approximately
3.25% of the total capital base of the investment club, putting the club (after
Monday) at -3.25%. This was followed by two days of drawdown which put the club
as far down as -7.28% (thus far being the maximum drawdown). SGIC recovered
quickly however, and soon was floating around the break even mark, sometimes
even edging into profitable territory.
Sadly, when the market closed on the
31st of October, the club's performance was at -0.92%. Although it
must be said that we are very pleased to have made up the brokerage costs that
we had to pay so very quickly. It is still very early days for the club and
there are still many months of trading ahead of us before we can really know how
we are performing in comparison with the overall market.
We have however created
a performance chart that we will be using to track the performance of the club
relative to the Top 40 index. For the moment, SGIC is being compared against the daily close of ALSI Futures contracts; which will be changed to the spot Top 40 index when next we give you an update.
 |
| Relative Performance of SGIC vs ALSI |
No comments:
Post a Comment