Thursday, August 30, 2012

UPCOMING LAST TO DAY TRADE FOR DIVIDENDS


Tomorrow marks the Last Day Trade for some some shares listed on the JSE. What this means is that if you want to earn any of the dividends listed below, you will have to make sure that you own the share by the time the market closes tomorrow.


Shares going Last Day Trade on 31-Aug

Share code


Share name


Dividend / interest rate
ABSP
ABSA Bank Ltd Prefs
dividend @ 3134.7cps
AFE
AECI Ltd
dividend @ 78cps
ARH
ARB Holdings Ltd
dividend @ 13.7cps
ASA
ABSA Group Ltd
dividend @ 315cps
BIL
BHP Billiton Plc
dividend TBA by 31/08/12
CLI
Clientele Ltd
dividend @ 67cps
CULP
Cullinan Hldgs Ltd
dividend @ 5.5cps
FFA
Fortress Income Fund Ltd
interest @ 53.34cpu
FFB
Fortress Income Fund Ltd
interest @ 9.95cpu
NED
Nedbank Group Ltd
dividend @ 340cps
RAR
Rare Hldgs Ltd
Rights Offer 232.01856 : 100 @ 8cps
SBKP
Standard Bank Group Ltd Prefs
dividend @ 3.25cps
SBPP
Standard Bank Group Ltd Prefs
dividend @ 345.55cps
TRU
Truworths Int Ltd
dividend @ 157cps  

You are then welcome to sell them again on Monday because if you are the beneficial owner at the close of business on LTD (being tomorrow in this case) the dividend is paid to you on payment date. However I would suggest waiting a week or two as on Monday (or Ex Div Day) they will more than likely fall by the same amount as what the dividend they will be paying out. So rather sell them once they are at break even or slightly above, which usually takes about a week or so, and then you would have successfully farmed a dividend. 

AMERICA'S $16 TRILLION DEBT BURDEN


If you haven't heard yet, the United States of America just hit $16 trillion in debt yesterday. On a gross, nominal basis, this makes the US, by far, the greatest debtor in the history of the world.

It took the United States government over 200 years to accumulate its first trillion dollars of debt. It took only 286 days to accumulate the most recent trillion dollars of debt. 200 years vs. 286 days. This portends two key points:


1. Anyone who thinks that inflation doesn't exist is a complete idiot;

2. To say that the trend is unsustainable is a massive understatement.

At an average interest rate of 2.130%, Uncle Sam will shuffle $340 billion out the door just in interest payments this year... and it's a number that's only going up. To put it in context, China owns so much US debt that the INTEREST INCOME they receive from the Treasury Department is nearly enough to fund their entire military budget.


It's rather disgusting when you think about it.


Yet when you look at the raw numbers, there is no sign of improvement anywhere on the horizon. Last year, the Treasury Department brought in about $2.3 trillion in tax revenue. They spent $2.9 trillion JUST on -mandatory- programs like Social Security and Medicare, plus the very sacrosanct defense budget.


In other words, the US government was $600 billion dollars in the hole before paying a dime of interest on the debt, or paying the light bill at the White House. In fact the government's own numbers reflect a budget deficit through the end of the decade, i.e. the debt level is only going to get higher. These are their own figures.


In the 19th century, the Ottoman Empire was facing a similar debt crisis. In just 11-years, the Ottoman central government went from spending 17% of its tax revenue on interest payments, to spending over 52% of its tax revenue on interest payments. Then came default. Eleven years. The US is at 15% right now. How long will it take for the interest burden to become unbearable?


History is full of examples of superpowers bucking under the weight of their debt. This is not the first time that it's happened, and it won't be the last.


Sovereign debt is a giant confidence game. Investors buy bonds on the belief that governments can (and will) pay. When that confidence is chipped away, the cost of capital becomes debilitating. And people tend to notice a $16 trillion debt burden.


This is banana republic stuff, plain and simple... and smart, thinking people ought to be planning on capital controls, wage and price controls, pension confiscation, and selective default. Because the next trillion will be here before you know it.

Author: Simon Black

Tuesday, August 28, 2012

PAIR TRADE IDEA - LONG MTN, SHORT ANGLO

The concept of pair trading has been with us since 1980's and like all great trading strategies, there are many different opinions on how it is to be done correctly. The basic idea behind pair trading is that traders take advantage of temporary changes in the correlation between two shares. In other words, if two shares are usually tightly correlated - move in the same direction at the same time - then a trader would look for a temporary change in this correlation and attempt to capitalise off this difference.

These opportunities are often only available to those who are sharp enough to see them and fast enough to take advantage of them. Therefore I offer a different way of looking at pair trading; a somewhat longer term view that should allow you to be in a 'market neutral' position, while making a low risk profit and without having to be glued to your computer at all times.

The pair trade that I propose is long MTN (MTN Group Ltd) and short AGL (Anglo American PLC). When we look at these two shares it very quickly becomes evident that MTN has been outperforming AGL for the last few years. So much so that on a weekly chart (bellow), their correlation coefficient is -0.829; which makes them almost perfect opposites. 

MTN vs AGL: Relative Strength Comparison and Correlation Coefficient

What this negative correlation really means, is that if one share goes up, the other share comes down. As you can see from the chart above, this been the case for some time now.

Note that this pair was chosen because both of these companies have a sizable weighting in the index and at one stage used to 'lead' our market and mostly because of their almost perfect negative correlation. As it is now the overall market is making new highs on an almost daily basis, yet these two drift further apart. Therefore it stands to reason that this negative correlation between these two shares will be with us for some time yet to come.

Even if AGL breaks its down trend and starts to rally, MTN should continue to outperform it. As you will notice; in the times that AGL rallied - or was in a bearish correction phase - the correlation between the two turned positive, yet during the times -as is the case now - that AGL falls, the correlation is once again negative. In plain English, what this means is that when AGL increased in price so did MTN, but when AGL decreased in price MTN did not, in fact, when AGL decreased in price MTN's price just kept on climbing.

Therefore in my view; this is a low risk trade that should provide a decent return and add  stability to a portfolio.


Wednesday, August 22, 2012

INVESTMENT CASE - MTN GROUP LTD AND CORONATION FUND MANAGERS LTD


With so much noise in the market place these days, it is hard to determine what is important and what is not. Every so often we hear that the market is at or near the highs of days gone by, and that Apple is the most valuable company of all time. Then, the very next day, after the US markets come off by a mere half percent, suddenly you start reading about how the world is going to end all over again and how Apple is overvalued to the core.

So how does one keep track of what is important and what is not? I guess the answer here would be to look at the secular trend and to decide for yourself. From what I have seen, the market is in an expansion phase - or a bull phase if you will. It rallies up, and then either consolidates or corrects a little, and then continues to rally.

Being of the belief that we are currently in a bull market, I will have to argue that what appears to be a coming correction on the US markets (and a pullback on the South African market) should be used to buy into good fundamental shares that offer long term value and growth prospects. It can be seen as this; you know what fruit you want to eat (it might even be apples), but you also know that currently this particular fruit is very expensive. So instead of not eating your chosen fruit or paying too much for such a fruit, you are waiting for other people to demand less of this fruit so that you can buy the fruit of your hearts desire and a much lower price.

Fruit of course, is an arbitrary example. So let’s look at some stocks.

I have mentioned Coronation Fund Managers Ltd (CML) before and will do so again. Coronation is a good solid company that we at Rock Capital Management believe will offer good long term value and continued growth. As mentioned before, R29.00 a share seems to be an attractive entry point.

Coronation Fund Managers Ltd


Then, let’s have a brief look at MTN Group Ltd (MTN). With its subscriber base up 6.9%, revenue up by 17.5% and headline earnings per share (HEPS) up 14.3% it certainly does look good in terms of sustainability and long term value.

We believe that this value is worth buying into, however – as with all investments - patience is a key factor. It is our view that the value that MTN offers is maximised at R150.00 per share, thus we will patiently wait for a correction and start accumulating when it reaches this level.

Further, it must be noted that at a 72% payout ratio, MTN will be paying a dividend of R3.21 on Monday the 3rd of September 2012. In order to earn this dividend, you will need to own the share at the close of business on Friday the 24th of August 2012.

On the technical side on the coin, there is further support for the above view. Bellow is a weekly chart of MTN. You will notice that there is a long term triangle formation that it has recently broken out of. The target this formation break is rather high, so I will not quote it here, but the chart certainly does pain a rather bullish picture.

MTN Group Ltd


I will stress again, patience is key in the world of investing. There is no shame in waiting to get into the right share, at the right time, at the right price.

Sources: SENS

Thursday, August 16, 2012

OFFSHORE INVESTING - OUR MODEL PORTFOLIO

It is often said that offshore investments are a vital component of any portfolio. We would like to share with you what our offshore holdings are in our managed offshore portfolios.

Each of the following stocks is approximately 8 - 10 % of the total portfolio. Also indicated here are the prices at which we purchased the shares.

Apple Inc $610
Source: finance.yahoo.com


Biogen Idec Inc $145
Source: finance.yahoo.com


CF Industries Holdings Inc $205
Source: finance.yahoo.com


Equinix Inc $178 
Source: finance.yahoo.com


WW Grainger Inc $205,99
Source: finance.lesaffaires.com


Mawson Resources Ltd $1,50
Source: finance.yahoo.com


Novo Nordisk A/S $155
Source: finance.yahoo.com


Panera Bread Company $155
Source: finance.yahoo.com


VISA Inc $139,50
Source: finance.yahoo.com


V.F. Corporation $150
Source: finance.yahoo.com


Valmont Industries Inc $126.79
Source: finance.yahoo.com


It is our feeling that all of the above stocks can be cycled into now if they are not already in your portfolio. All of the stocks above have met our fundamental requirements for investment and we should see a good return on our portfolio. 


Friday, August 10, 2012

INVESTMENT CASE - CORONATION FUND MANAGERS LTD

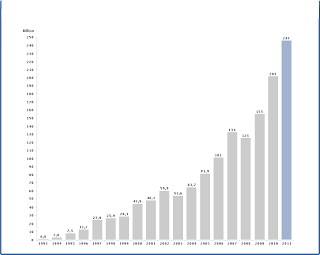
With over R 247 Billion under management and a firm growth trend in place, Coronation Fund Managers is a force to be reckoned with. Currently trading at R30.05, we see a lot more value in this share.  Coronation is actively and aggressively growing its market share in the fund management business and will likely offer great returns to its shareholders in both the medium and long term.

Coronation Fund Managers assets management 1993 - 2011. Source www.coronation.com 


Having already added just over 50% to its share price in the last 12 months, we believe that the best is yet to come with the fundamental value of the company being somewhat higher than what it is trading at present. According to our evaluation model, its current price should be R34.40 with a dividend yield of 5.7%. Clearly then, it is trading at a discount of 12.6%.


Coronation Fund Managers - Weekly Chart


Looking at the chart above, it is clear that there is a strong long term trend in place and that good buying opportunities present themselves from time to time. Such an opportunity is fast approaching in the coming weeks. There is the potential for some resistance (possible double top), however the presence of a hammer formation on a support level and a moving average provide reassurance that the trend is in place and will continue it's upward path to spite the mild resistance.


Coronation Fund Managers - Daily Chart


When we look at the daily chart, the picture becomes clearer. With a support level at R29.00 that looks as if it will line up perfectly with the area between the two 'buying zone' moving averages, it seems that the time to buy is close at hand. 

Tuesday, August 7, 2012

IMPORTANT INFORMATION REGARDING FSP'S


In light of the recent debacle surrounding a certain unregistered and illegally administrated fund that is currently being sequestrated - as reported by moneyweb.co.za, we here at Rock Capital Management find it most distressing that investors were so blatantly hoodwinked and therefore think it prudent to not only warn investors about investing in non-registered - and therefore non-regulated - collective investment schemes, or placing funds with non-registered financial intermediaries and service providers.

Rock Capital Management would also like to take the opportunity to highlight what accreditation investors should look for when dealing with investment professionals.

First and foremost is registration with the Financial Services Board (FSB). Every registered financial institution, advisor or intermediary carries a FSB licence number which should at all times be visible to clients on all official communications and documents as well as be visibly displayed at their business premises.

The Functions of the FSB are to:
·   Supervise the compliance with laws regulating financial institutions and the provision of financial services;
·   Advise the Minister on matters concerning financial institutions and financial services; and
·   Promote consumer education programmes and initiatives by financial institutions and bodies representing the financial services industry.

If you would like to check if the financial services provider that you are dealing with is in fact registered with the FSB, you can search the FSB website by using either their registered name or their FSB licence number. Once you have found your financial services provider on the FSB website, you can also see exactly which specific financial products and services they are approved and registered to provide.

There are various categories of FSB licences which carry differing requirements in order to obtain them. For example; Rock Capital Management carries a Category IIA FSP licence, which allows it to offer a wide range of investment and advisory services including the operation and administration of Hedge Funds; but also poses on it the most onerous of compliance requirements. What this means in laymen’s terms, is that Rock Capital Management has very strict regulatory requirements and rules to which it is must adhere at all times.

This should do well to put investors at ease, however, there is more to be said on the topic. The custody of client funds is also a very important factor to be taken into consideration. In order to receive custody of clients’ funds and securities, financial services providers need to be registered to do so. If they do not wish to hold clients’ funds and securities, they must appoint a registered custodian. In the case of Rock Capital Management, there are appointed custodians, which are; PSG Stockbrokers, 28E Capital and Allan Gray.

Funds kept in the custody of these registered custodians are held in the clients’ names and guaranteed by the JSE Guarantee Fund with exception of Allan Gray, as those funds are held in a collective investment scheme (unit trust) and individual clients are the owners of units within the scheme. In other words, all cash and securities in these accounts are safeguarded and held in the clients’ name with the JSE, or held by Allan Gray in a portfolio of shares that is unitized and these units are owned by clients thus making them the beneficial owners of a portion of the securities being held. This also means that no payments may or can be made to any account other than the account that the clients have supplied FICA documentation for, thus further ensuring the protection of funds.

Rock Capital Management would like to encourage all investors to make sure that they are dealing with registered and licensed financial advisors and intermediaries before they invest in any products or make use of any services that such an advisor or intermediary may offer.

Should you have any queries or simply seek assistance with finding out if your financial services provider is in fact registered and licensed to perform the specific financial services that they are offering, please feel free to contact Rock Capital Management on 086 111 7625 and we would be happy to assist.

Thursday, August 2, 2012

RECORD HIGH FOR SA STOCKS

South Africa’s All-share index hit a record high for the third straight trading session on Thursday, edging up as shares of miners and brewers continued to gain on optimism for growth in Africa’s top economy. 

The All Share [JSE:J203], the broadest measure of South African stock performance, touched a record of 35,162.91 before edging back. It was up 0.06% at 35,092.78 at 07:11 GMT. 

The benchmark Top 40 - (Tradeable) [JSE:J200] briefly touched 30,968.16, its highest since 2008, before giving up some gains. It was flat at 30,864.23.


Sources: 
http://www.fin24.com/Markets/Equities/SA-stocks-hit-record-high-for-third-day-20120802
Standard Bank Online Securities